 how-to
How to Maintain Industrial Water Quality: 7 Steps
Table of Contents
- Step 1: Map Your System and Establish a Baseline
- Step 2: Set Your Industrial Water Testing Frequency
- Step 3: Apply Water Quality Monitoring Best Practices
- Step 4: Explore Industrial Water Treatment Alternatives
- Step 5: Build a Preventative Maintenance Schedule
- Step 6: Troubleshoot Common Contamination Signs
- Step 7: Ensure Regulatory Compliance and Operational Efficiency
- Conclusion: Turning Water Quality Into a Repeatable Process
- Frequently Asked Questions
Last Updated: September 11, 2026
Step 1: Map Your System and Establish a Baseline
Learning how to maintain industrial water quality starts with knowing exactly what your system contains. You cannot manage what you have not measured, and you cannot spot a problem without a reference point.
Mapping means tracing every pipe, tank, pump, and treatment unit from intake to discharge. Document the following:
- Source water profile: Where the water originates and its baseline chemistry
- Distribution layout: Pipe diameters, materials, dead-end runs, and flow rates
- Treatment equipment: Filtration systems, chemical dosing points, and disinfection units
- Operating parameters: Temperature ranges, pressure setpoints, and turnover rates
A baseline water analysis captures pH balance, total dissolved solids, and contaminant concentration at each key point. This snapshot becomes your benchmark. When readings drift later, you will know precisely where and by how much.
What to Document for Your Baseline
Record source water chemistry, system capacity, and current treatment performance in one central log. Include pipe material because corrosion inhibition needs differ between carbon steel and copper. Note any dead legs or low-flow zones, since these are where water stagnation and biofilm control problems begin.
Step 2: Set Your Industrial Water Testing Frequency
Industrial water testing frequency depends on system criticality, volume, and risk exposure. A cooling tower serving a data center needs tighter monitoring than a low-volume washdown line (ashrae.org). The goal is not to test everything constantly, it is to match your testing cadence to the cost of a missed problem.
Testing Schedule by System Type
| System Type | Minimum Frequency | Key Concern |
|---|---|---|
| Cooling towers | Weekly | Biofilm control, scale prevention |
| Boiler feedwater | Daily | Corrosion inhibition, pH balance |
| Process rinse water | Per shift | Contaminant concentration |
| Closed loops | Monthly | Water stagnation, TDS creep |
| Reverse osmosis permeate | Daily | Conductivity, membrane integrity |
| Low-use or seasonal lines | Weekly flush + test | Stagnation, Legionella risk |
What to Test: The Core Parameters
Prioritize the parameters that drive your equipment reliability. pH balance and total dissolved solids belong in every routine panel. Add microbiological testing where stagnation risk is high, and analytical testing for metals where corrosion is a concern.
A practical industrial panel typically includes:
- pH: Target ranges vary by system, boiler feedwater often runs alkaline (roughly 8.5-10.5) to protect metal, while cooling water may sit closer to neutral (the EPA). Confirm your equipment manufacturer's specification.
- Conductivity / TDS: Rising conductivity signals dissolved solids accumulation and cycles-of-concentration creep. Track the trend, not just the absolute number.
- Alkalinity and hardness: These drive scale potential. Hardness above your treatment train's design threshold means scale is forming somewhere.
- Chlorine or biocide residual: Measure at the farthest point in the loop, not at the dosing point. A residual that reads fine at injection but zero at the far end means the biocide is being consumed before it reaches the problem zone.
- Corrosion indicators: Iron, copper, and zinc concentrations in the water tell you whether pipe and equipment metal is dissolving. A rising iron trend in a carbon steel system is an early corrosion warning.
- Microbiological counts: Heterotrophic plate counts (HPC) and, where relevant, Legionella testing (the CDC). Most facilities set an internal action level rather than waiting for a regulatory limit.
Manual Testing vs. Continuous Monitoring
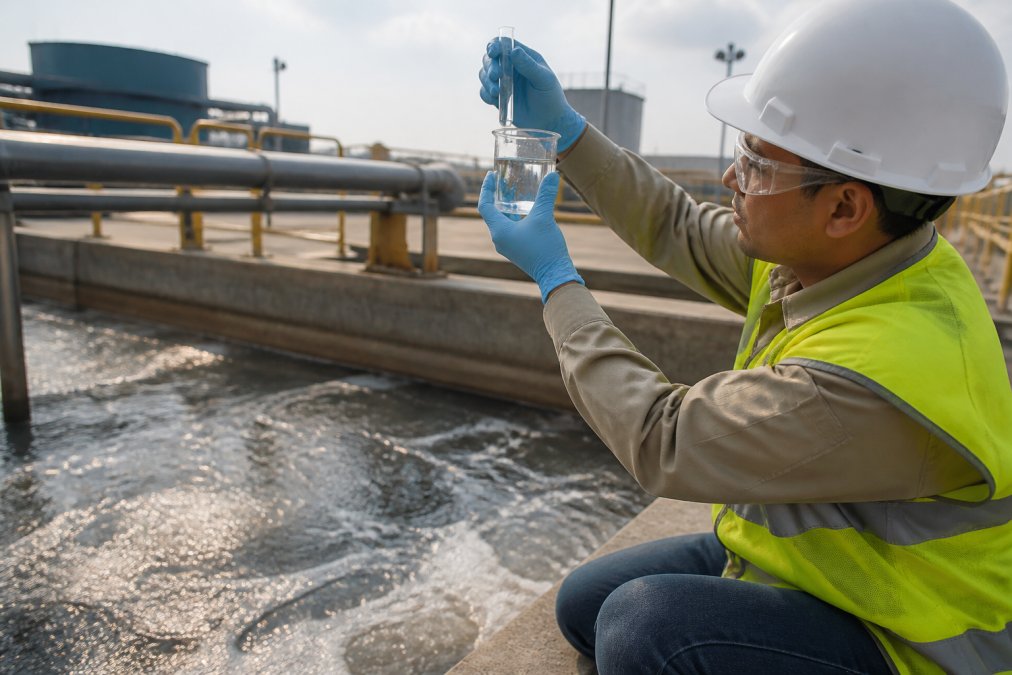
Manual grab samples catch what sensors miss; continuous sensors catch what a once-a-week sample never sees. Pair both wherever the cost of a surprise outweighs the cost of instrumentation.
This is where most industrial operations are changing fastest. Real-time sensor integration, inline conductivity, pH, ORP, and turbidity probes tied to a supervisory control system, lets you see chemistry shifts as they happen rather than days later. The practical benefit is dosing control: instead of adding biocide on a fixed calendar, you dose when the sensor shows demand. That reduces chemical spend and avoids over-dosing that can itself damage equipment.
A layered monitoring approach looks like this:
- Continuous sensors on the parameters that move fast and matter most, conductivity, pH, ORP, and flow.
- Daily or per-shift grab samples for parameters sensors cannot read reliably, such as specific ions or microbiological counts.
- Weekly or monthly laboratory analysis for comprehensive panels and trend validation.
- Annual or semi-annual full system audits that re-baseline the entire system.
Setting Your Own Frequency
Use the table above as a floor, not a ceiling. Increase frequency when any of these apply: the system serves a critical process with no redundancy, the water is reused or recycled, the system has known dead legs or low-flow zones, or you have had a contamination event in the past 12 months. Decrease frequency only after a documented period of stable readings, and never below the minimum your equipment warranty or permit requires.
Step 3: Apply Water Quality Monitoring Best Practices
Water quality monitoring best practices come down to three habits: calibrate, log, and trend. A meter that drifts out of calibration produces confident, wrong numbers, which is worse than no data at all.
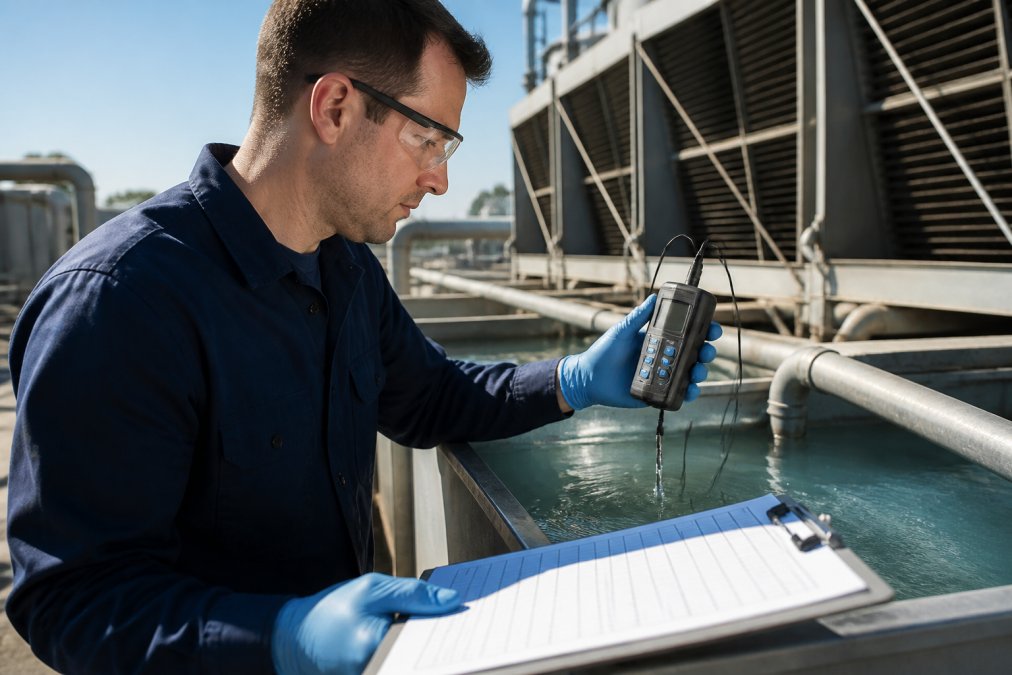
Calibrate sensors on a fixed schedule and record the calibration in the same log as your readings. Log every value, not just the outliers. Trend the data weekly so you catch slow drift in contaminant concentration before it becomes a failure.
Parameter monitoring works best when it is layered. Manual grab samples catch what sensors miss; continuous sensors catch what a once-a-week sample never sees. Pair both wherever the cost of a surprise outweighs the cost of instrumentation.
Step 4: Explore Industrial Water Treatment Alternatives
Industrial water treatment alternatives range from conventional multi-stage trains to newer approaches that cut chemical use and waste. The right choice depends on your contaminant profile, your discharge constraints, and how much space and labor you can commit. There is no universally best treatment train, only the one that fits your water and your operation.
Conventional Treatment Train
Most facilities run some version of coagulation, flocculation, sedimentation, filtration, and disinfection. Coagulation neutralizes particle charges so they clump; flocculation grows those clumps; sedimentation lets them settle; filtration systems polish what remains; disinfection finishes the job. It is proven, well understood, and easy to operate at scale.
The trade-offs are real, though. Conventional trains consume chemicals continuously, generate sludge that must be dewatered and disposed of, and require significant footprint. They also respond slowly to changing influent quality, if your source water shifts, the train needs operator intervention to re-balance.
Emerging Alternatives
Newer options target specific pain points:
- Membrane and advanced filtration systems reduce chemical dosing demand and produce more consistent effluent quality. Reverse osmosis and ultrafiltration can remove dissolved solids that conventional filtration cannot. The trade-off is concentrate management, you now have a reject stream to handle, plus higher energy and membrane replacement costs.
- On-site generation of treatment chemicals cuts storage and handling risk. Generating biocide or chlorine on demand means you are not storing bulk hazardous chemicals, which reduces regulatory burden and safety exposure.
- Real-time sensor integration lets you dose only when chemistry actually calls for it, which trims both cost and waste. This is less a standalone treatment technology than a control layer that makes every other technology more efficient.
- Electrochemical and advanced oxidation processes target specific hard-to-remove contaminants, including some organics and recalcitrant compounds. These are typically applied as a polishing step rather than a primary treatment.
Choosing Between Alternatives: A Cost-Benefit View
Most treatment decisions get made on capital cost alone, and that is usually a mistake. The total cost of a treatment train includes:
- Capital cost: Equipment purchase and installation.
- Operating cost: Energy, chemicals, water, and labor.
- Maintenance cost: Membrane replacement, sensor calibration, parts, and planned downtime.
- Waste cost: Sludge disposal, concentrate handling, and discharge fees.
- Risk cost: The cost of a treatment failure, unplanned downtime, product loss, permit violation, or equipment damage.
A treatment alternative that costs more upfront but cuts chemical use, reduces waste volume, and lowers failure risk often pays back within a few years. The reverse is also true: a cheap system that requires constant operator attention and generates large waste streams can cost more over its life than a higher-capital alternative.
A practical way to compare options is to estimate the annual cost of each and add a risk-adjusted figure for failure. If a treatment train has a 10% chance of causing a day of unplanned downtime per year, and a day of downtime costs your operation a known figure, that expected cost belongs in the comparison. Most practitioners find that proactive treatment investment is justified by avoided downtime alone, before any chemical or waste savings are counted.
Matching Treatment to Contaminant
The right treatment depends on what you are removing:
- Suspended solids and turbidity: Conventional coagulation, flocculation, and filtration.
- Dissolved solids and salts: Reverse osmosis or ion exchange.
- Scale-forming minerals (calcium, magnesium): Softening, antiscalant dosing, or reverse osmosis.
- Microbiological contamination: Biocide dosing, UV disinfection, or ozone.
- Corrosive water (low pH, high chloride): pH adjustment, corrosion inhibitor dosing, or material upgrades.
- Organics and specific industrial contaminants: Activated carbon, advanced oxidation, or specialized media.
Step 5: Build a Preventative Maintenance Schedule
Preventative maintenance is the difference between planned work and emergency work. A schedule that nobody follows is decoration, so build one your team can actually execute.
Tie every task to a trigger: calendar date, runtime hours, or a monitoring threshold. System flushing belongs on a fixed cadence, not a "when we remember" basis. Scale prevention tasks should fire before efficiency drops, not after.
A cost-benefit view helps here. Every hour of planned maintenance buys back unplanned downtime, and downtime in a 24/7 operation costs far more than the labor. Maintenance scheduling is not overhead; it is insurance you control.
Step 6: Troubleshoot Common Contamination Signs
Common contamination signs show up long before equipment fails, if you know what to look for. Treat these as early warnings, not cosmetic issues.
- Discolored water or staining: Often points to corrosion or biofilm in the lines
- Foul odor: Usually signals microbiological growth or stagnation
- Pressure drop across filters: Indicates fouling or scale buildup
- Rising chemical demand: Means your treatment train is losing ground
When a sign appears, isolate the affected zone, pull a sample, and compare it against your baseline. Do not dose your way out of a symptom. Find the source first, because adding chemical to a biofilm problem just feeds it.
Step 7: Ensure Regulatory Compliance and Operational Efficiency
Regulatory compliance and operational efficiency are not opposing goals. A well-run system satisfies both because clean, stable water protects equipment and keeps you inside permit limits.
Industrial water standards vary by discharge point and process, so confirm which rules apply to your operation with your state environmental agency. Compliance depends on documentation as much as chemistry: keep your water analysis records, calibration logs, and maintenance history audit-ready at all times.
Operational efficiency follows the same discipline. Water treatment solutions that run on data, not habit, cut chemical waste and extend equipment life. Water sustainability and reuse opportunities often emerge once your monitoring is tight enough to prove the water is clean enough to reuse.
Conclusion: Turning Water Quality Into a Repeatable Process
The operations that win at water quality are not the ones with the fanciest equipment. They are the ones with a documented baseline, a testing cadence they actually keep, and a maintenance schedule tied to real thresholds.
If your facility needs a dependable, high-volume supply of clean alkaline water to support that process, Our True North, LLC offers a simple pickup model that removes delivery delays from the equation. Our high-volume alkaline water supply, consistent quality, and flexible pickup schedule are built for data centers, industrial sites, construction crews, and fire departments that cannot afford to wait.
Get started with Our True North, LLC and lock in reliable water access for your critical operations.
Frequently Asked Questions
How often should industrial water systems be tested for quality?
Industrial water testing frequency depends on the system and its criticality. High-risk systems like cooling towers and boilers typically need daily or weekly checks for key parameters such as pH, conductivity, and biocide levels, with full lab analysis monthly or quarterly. Lower-risk closed loops may only need monthly monitoring. Establish a written schedule based on your equipment manufacturer's recommendations, your historical data, and any applicable regulatory requirements for your industry.
What are the most effective alternatives to standard industrial water treatment?
Industrial water treatment alternatives include membrane filtration (reverse osmosis, ultrafiltration), UV disinfection, ozone treatment, and advanced oxidation processes. These can replace or supplement conventional coagulation, flocculation, sedimentation, and chlorination. The right choice depends on your contaminant profile, volume needs, and budget. Many facilities use a hybrid approach, combining conventional pretreatment with membrane or UV polishing to meet specific quality targets while managing costs.
What are the 7 key water quality parameters for industrial compliance?
The seven core parameters are pH, total dissolved solids (TDS), conductivity, turbidity, residual disinfectant, microbiological indicators, and specific contaminants like heavy metals or silica. These cover the physical, chemical, and biological dimensions that regulators and equipment manufacturers care about. Monitoring these consistently helps you prevent scale, corrosion, and biofilm while staying within permitted discharge limits and protecting your infrastructure.
How do you maintain water quality in industrial cooling systems?
Cooling system maintenance focuses on controlling scale, corrosion, and biological growth. Test pH, conductivity, and inhibitor levels regularly; adjust chemical dosing to stay in range; and perform scheduled blowdown to manage dissolved solids. Inspect for biofilm and clean fouled surfaces promptly. Real-time sensors for conductivity and pH can catch drift early. Keeping a log of all readings and treatments helps you spot trends and justify adjustments to your program.